AI, Cloud & Digital Transformation Experts | Genesis Digitech
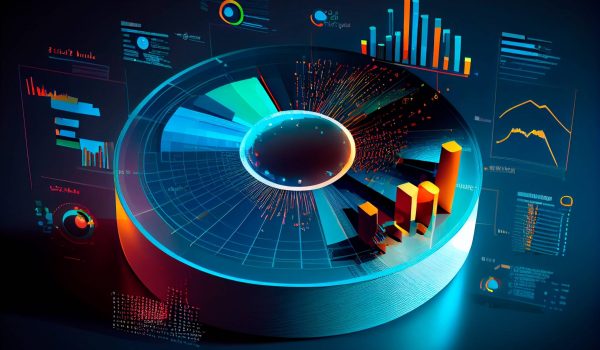

Dashboard Development
Design dynamic dashboards that consolidate key metrics into one interactive interface. These dashboards empower stakeholders with real-time insights to drive smarter, faster decisions.

Data Mapping
Transform raw data into structured, relatable formats by mapping relationships and trends. This service ensures clarity and alignment across complex datasets for impactful analysis.
Infographic Design
Create visually appealing infographics that simplify complex information into compelling visual narratives. These designs enhance communication and engagement in reports, marketing, or presentations.

Custom Design Visualization Tools
Build tailored visualization tools that align with unique business goals, enabling organizations to interpret data seamlessly and enhance decision-making capabilities.

Reporting and Presentation Services
Develop polished, professional reports and presentations that combine analytics with captivating visuals. These services help to effectively convey insights to teams and stakeholders.

Tool Implementation
Seamlessly integrate industry-leading data visualization tools into business processes. This service streamlines workflows and elevates data analytics capabilities.

Interactive Visualisation
Implement interactive tools like heatmaps and drill-down charts to encourage hands-on exploration of data. This fosters deeper engagement and unveils hidden insights.
